End of 2 Month Trial Period: Performance Report (12/29/2017 – 3/1/2018)

This is the moment you have all been waiting for…… our first performance report on our LIVE 2 month algorithm trial period!

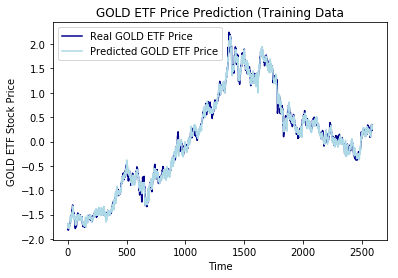
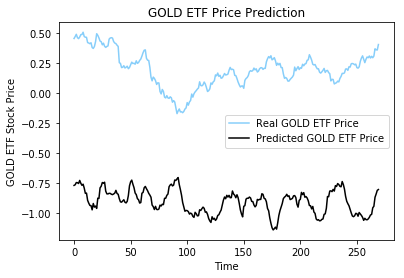
After 2 months of trading securities based on the A.I. algorithms, we have seen some incredibly surprising things. During the 1st week of trading, we only implemented our strategy #1, where we wrote options based on the predictions from the algorithm. We predicted price movement of three securities, and 2 of them are not only correct, but correct in a big way. However, because of the nature of the strategy not being Black Swan proof, that one wrong prediction (GLD ETF) caused us to lose -3% of the entire hedge fund in the first week of trading!  From this, we did not benefit at all from the predicting power of the A.I., because it worked and we lost money! We realized that this strategy is not as effective as we expected it for 2 main reasons: 1st, even though with the algorithm, we can create a positive expected value, alpha, we are not protected from the high impact & low probability black swan events. We can potential be knocked out of the game. (I really don’t want to go back to being just a Whiting Engineering nerd at Johns Hopkins, haha) 2nd, we are not able to benefit from the positive Black Swan events due to the nature of the strategy. This strategy felt like playing a game of Russian Roulette, and with the algorithm, we are merely just slightly decreasing the chance of getting shot, while the benefit from not getting shot stayed the same. We have also realized that the algorithm may not be most efficiently used if we are merely using it to predict the up/down price movement a month later. 

From what I saw from this, I decided to halt trading for a week to redesign the algorithm, as well as rethink the trading strategy. I changed the original algorithm into an algorithm that can be used as a tool in statistical arbitrage swing trading. The instead of predicting whether the price would be higher or lower in a month, it would now predict trend-following / trend reversal / buying or selling points, etc. I selected a pool of 30 “fundamentally strong” companies, and I used the algorithm to pick out the 5 companies that are most likely to go up in the short term, and I selected a pool of 30 “fundamentally weak” companies and used the algorithm to pick out 5 companies that are most likely to go down in the short term. I would open long positions for the 5 strong companies likely to go up and short positions for the 5 weak companies likely to go down, and I would alter or close the positions if the algorithms thinks that the companies are no longer likely to go the direction that the algorithm initially predicted. We would hold on to cash if the algorithm thinks that no opportunities arise. 

Performance Report: 

During the first month, the Dow Jones Industrial Average went from 24,849.63 (open price 12/29/2017) to 26,149.39 (close price 1/31/2017, which is a +5.2% gain. During this first month, we took a week and a half break to redesign the codes and strategy, so we missed out on the bull ride, as well as we lost a lot of money in the first trade of the hedge fund that went nearly belly up. After we change the strategy, Havergal’s flagship quant fund (Fraction Capital) made up for the early first week loss and ended up with +1.3% gain for the first month. 

During the second month, the market enter a period of extreme volatility, where there were two 1,000+ points drop in the Dow in the same week. The Dow closed March 1st at 24,608, which is a -5.9% drop. During this period, our fund was also impacted by the volatility. However, the algorithm, which was programed for swing trading, steered the fund slightly away from the storm. Even though several of our short position candidates skyrocketed in price, (such as SNAP), and the long position companies were free-falling we still managed to not get shaken enough to flip the boat and fall into the water. Fraction posted a gain of +0.1% during arguably the craziest month of the market in years. 

Overall, during the two months of live trading trial period of the algorithm, Fraction had a gain of +1.40%, while the Dow Jones Industrial Average suffered a loss of -0.98%. I have decided to halt trading after this 2 months trial, because I want to further improve the algorithm based on what I learned from the 2 months. The fund will be back in live trading soon. 

“Gotta learn stuff from denial (trial) and error” – Ricky from Trailer Park Boys 

– Yulin Zhu (Fund Manager) 3/3/2018

Using ANN algorithm for predicting equity price movement

This week, I have preprocessed and used the historical data of several companies on the Artificial Neural Network algorithm. As of right now, I have finished the testing and cross validation for Ford (F), and unfortunately it is not looking too good. There has been a huge variance in accuracy, and the average accurate rate is sub-60%. 😦

Based on my understanding, I think this is because the price movement of Ford is more strongly based on company news, as well as the actual quality of the company’s presence in the consumer market, instead of purely based on historical price movement. We will be testing this on several other companies, such as AMD, SVU, and several other index ETFs.

Skraahhhh pop pop


Integrating USD data and Volatility into GLD algo

After today’s wild day for GLD ETF price, I have realized that even though the algorithm cannot predict the direction of the news that will affect the underlying securities, it is able to predict the magnitude of the investors’ reactions to the news. The ANN algorithm is unable to fully predict the actual price of the security, however, it is able to predict the general market atmosphere for the security. As we implement the strategies this week, we saw the price of GLD ETF being pulled towards our predicted result, even though there has been news driving the price movement in the opposite direction.

We will begin to take a multi-dimensional approach to analyzing securities using our algorithms. To yield more reliable, and hopefully more accurate, predictions, we will integrate the data of correlated securities into the prediction algorithm for GLD ETF. To ensure maximum profit and highly probability of profit, we will also create an ANN algorithm to predict volatility of the underlying securities. By doing so, we can more effectively implement both long and short option strategies. Even though it has only been a short period of time, we have seen effectiveness in our algorithm and trading strategies. We are constantly wondering what else we can do with our Deep Learning Algorithms.

We will have the 2nd weekly paper trading performance report on Friday, November 3rd.

“Skrrrrrat, Skidi-kat kat….

….BOOM” – Big Shaq (2017)

15506

RNN LSTM Regression

Recently, we have been working on a Recurrent Neural Network (RNN) Deep Learning algorithm using the Long Short Term Memory (LSTM) to try to predict the price of Gold over a period of 270 trading days from mid-2016 to about right now when the blog is posted.

The parameters that we have used are: 10 LSTM Units, Batch_size = 32, Epoch = 500. (The regression fit on the training data have plateaued with epoch = 500)

The RNN is a supervised deep learning machine learning algorithm, with long short term memory (LSTM), is highly effective for time-series analysis. We were curious to see how well it is able to predict Gold ETF price over a period of time using time-series and regression, instead of the categorical predictions done by the ANN algorithm that we have been using currently for our analysis. Today, we finished constructing a RNN algorithm for Gold, and the testing results showed that, unlike the categorical prediction, the actual price of the underlying is far more unpredictable than we have anticipated. Because of the complex pattern of the GLD underlying training data that we used to train our machine, there has been noticeable overfitting in the process. It is highly difficult to capture the randomness of the actual stock price without the machine learning algorithm over-committing to the training data, thus the algorithm developed from the training data is not effective in predicting new data it has not seen before.

training data RNN
Regression Fit for Training Data


testing data RNN
Regression Fit for Test Data


The algorithm can very precisely model most of the details of the data it trains on, however when new data is being given to the algorithm, it is not predicting the future stock price with enough accuracy.

Take away from this: From this, we learned that it is ineffective trying to predict future stock price using a regression approach, because it is more prone to overfitting as well as more unpredictable. However, we do love the approach of using RNN and the LSTM time-series analysis, so we will be working on developing an algorithm for making categorical price predictions based on the RNN.

Tomorrow, we will have our first weekly trading performance report.

Eeeskeeeeetit.

15747